Decode Your Power BI Workloads: A Guide to SQL Server Profiler
20 min
Mateusz Malik
Published Dec 16, 2025

When your organization uses Power BI Premium Capacity, effective utilization of that capacity can be critical. Rather than endlessly scaling up packages, it is often more beneficial to take optimization measures to make the most available resources.
SQL Server Profiler provides real-time visibility into Analysis Services activity. By connecting via the XMLA endpoint, you gain detailed insight into what is happening behind the scenes in your workspaces: from DAX/MDX queries, to dataset refresh stages, to user interactions. This information gives a clear view of the processes occurring during each data refresh or regular report usage.
Although Profiler is no longer actively developed, it remains a quick way to see what is happening under the hood and to pinpoint performance bottlenecks and backend errors. The setup itself is relatively straightforward, but interpreting the results and taking appropriate actions requires some experience.
When is it helpful?
Use Profiler when reports feel slow, refreshes are flaky, you need backend error details, you’re validating Live/DirectQuery behavior, or you’re troubleshooting capacity. Treat it as a backend complement to Performance Analyzer and DAX Studio - giving insight the front end can’t.
Prerequisites & Constraints
To use Profiler with Power BI:
The workspace must be assigned to Premium Capacity or PPU.
The XMLA endpoint must be enabled (at least Read).
You must have dataset access and Microsoft Entra ID (Azure AD) credentials with MFA.
Install the latest version of SQL Server Management Studio (SSMS), which includes Profiler.
Keep in mind that the Profiler captures database/model-level events (not server-level).
Connecting Guide
1) Open Profiler
Open SQL Server Profiler and choose File → New Trace.
2) Select server type
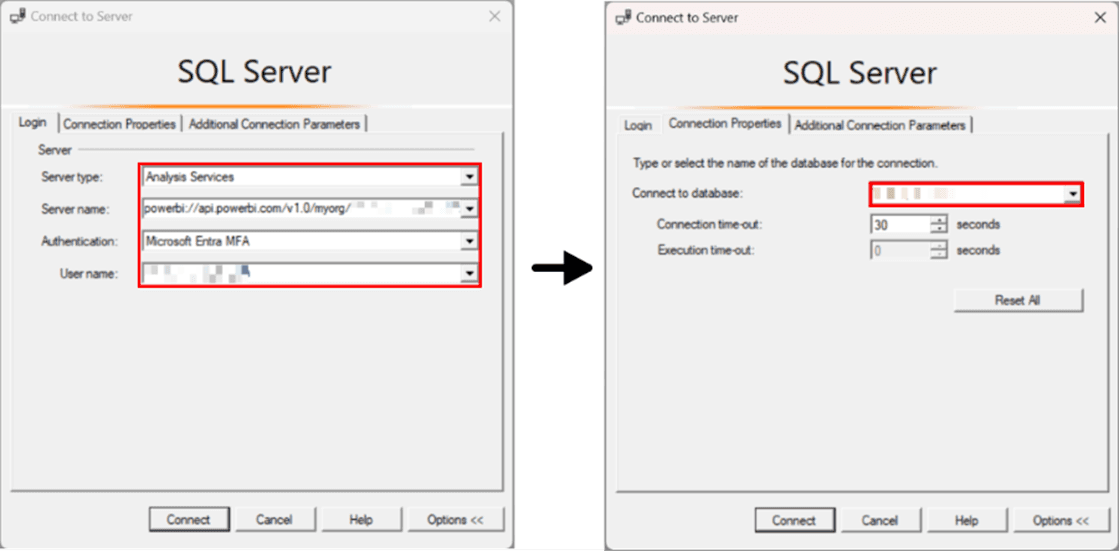
In Connect to Server, set Server type to Analysis Services.
3) Enter server name (XMLA endpoint)
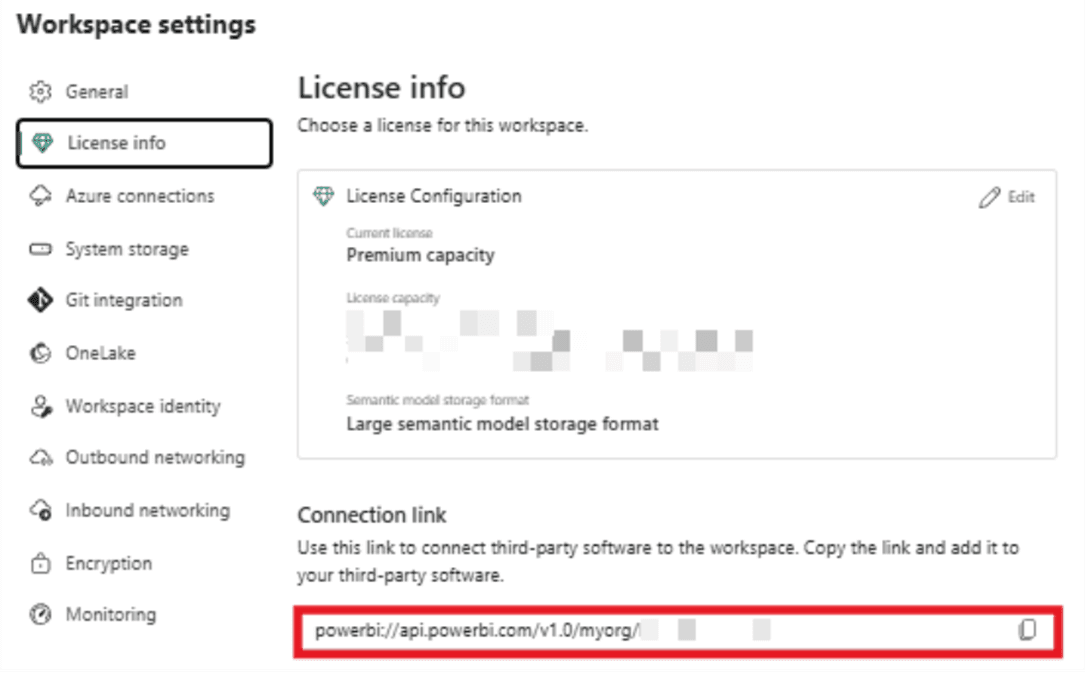
Set Server name to: powerbi://api.powerbi.com/v1.0/myorg/<workspace-name>
Where to find it: In the Power BI Service, go to Workspace settings → License info → Connection link (this exposes the XMLA endpoint for Premium/PPU).
4) Choose authentication
Set Authentication to Microsoft Entra MFA.
5) Provide user name (if enabled)
In Username, enter your work account (UPN)
6) Select the dataset
In Connection Properties, click Browse server…, sign in, and select the dataset to trace. Click Connect.
7) Name the trace and choose events
In Trace Properties:
Enter a Trace name (e.g., PBI_Refresh_Debug).
Open Events Selection and pick only what you need (e.g., Job Graph, Progress Report End, Query Events).
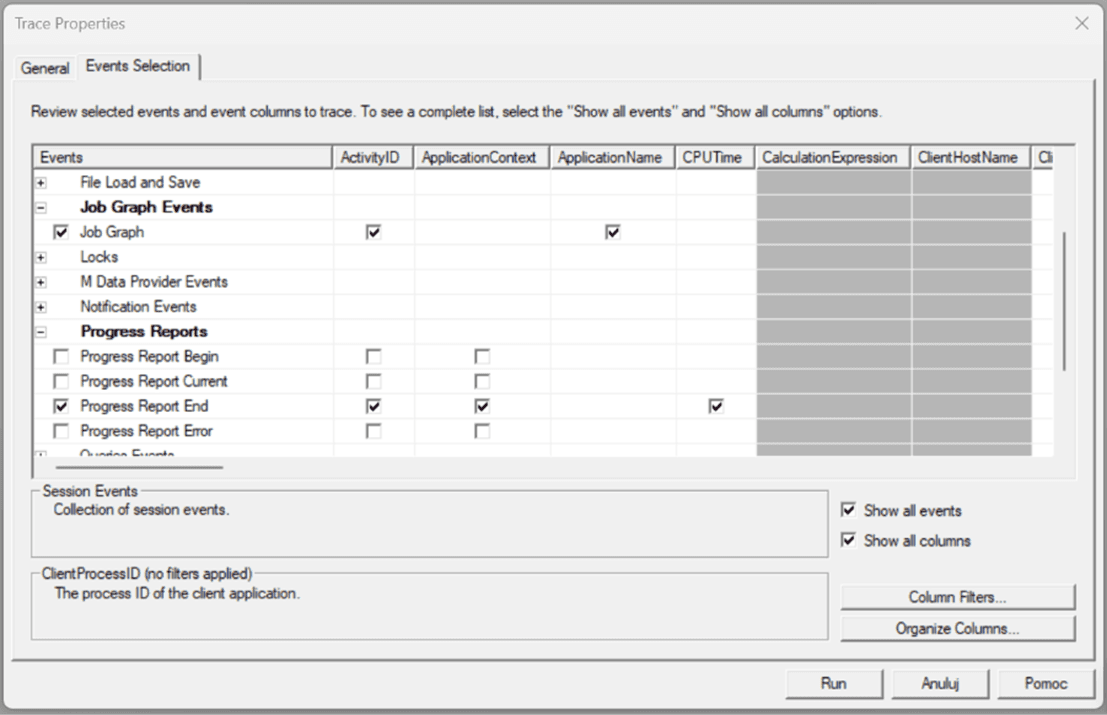
8) Start tracing
Click Run to start the trace.
Analyzing a Dataset Refresh
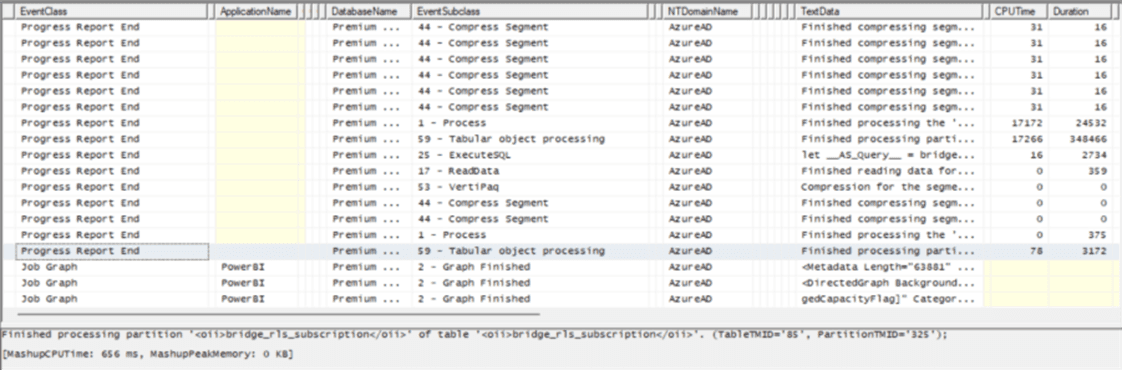
To identify which tables and stages slow down a dataset refresh, it helps to capture a focused trace. In SQL Server Profiler, enable the Job Graph and Progress Report End events, start the trace, trigger a “Refresh Now” in the service, and stop and save the trace once the refresh finishes. You can read the stages from the rows under EventClass and TextData, which show which step has completed and what action it was associated with.
Entries like ExecuteSQL/ReadData correspond to Read, Process/Tabular object processing indicates Evaluate, and Compress Segment/VertiPaq refers to Compress/Write. Job Graph events frame these steps per table or partition and show how much work ran in parallel.
Interpret the timings accordingly. Long Read times usually point to slow sources or expensive Power Query transformations, so simplifying transforms and pushing filters upstream can help. Dominant Evaluate times suggest heavy calculated columns or measures, which could benefit from pre-aggregation or moving logic to the source. Long Compress/Write phases typically reflect high data volume or cardinality; using partitions, Incremental Refresh, and trimming high-cardinality columns can improve performance. After making changes, re-run the trace and compare durations for the same tables and steps to confirm improvements.
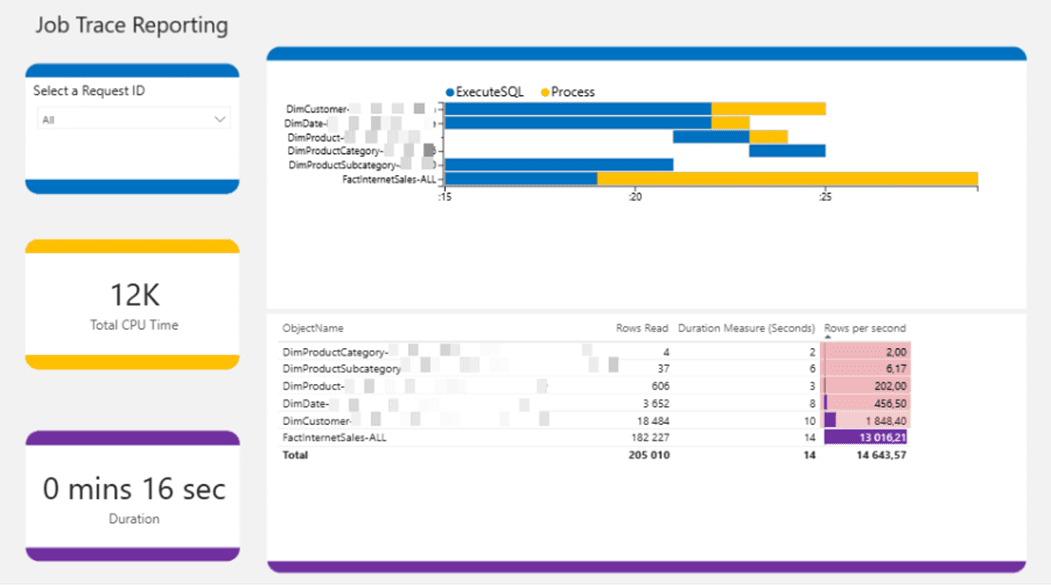
Visualizing your trace in Power BI (PBIX)
For a clearer view of refresh behavior, you can visualize the trace using the community file: Analyse My Refresh.pbix
The timeline splits each table into ExecuteSQL (blue) and Process (yellow), which correspond to Read and Evaluate + Compress/Write respectively. Long blue bars suggest source/M issues; long yellow bars point to in-engine pressure from volume/cardinality. If you need to distinguish Evaluate from Compress/Write in detail, return to Profiler and align the PBIX timeline with Progress Report End entries.
Conclusion
Profiler is a quick backend X-ray for Power BI via XMLA. It answers what runs, when, and how long, so you can target true bottlenecks. Combine it with Performance Analyzer, DAX Studio, and PBIX-based trace visualization to move from symptoms to root causes and make effective design decisions (sources, M, model, aggregations, partitions, incremental refresh).
Common Connection Issues
If there’s no login prompt, datasets don’t load, or the trace is silent, reset authentication: close Profiler/SSMS and delete
%APPDATA%\Microsoft\SQL Server Management Studio\<version>\UserSettings.xml
Then relaunch - MFA should reappear and dataset selection should work.
Mateusz Malik
Business Intelligence Developer
Dec 16, 2025
Looking for a trusted partner for your next cloud project?
Reach out to us and tell how we can help
Featured

Cloudfide’s Business Intelligence Newsletter – JULY 2026
Sebastian Jagniątkowski
Jun 26, 2026

Helpful Assistant, Not a Full Report Developer
Mateusz Malik
Jun 26, 2026
Cloudfide’s Business Intelligence Newsletter – JUNE 2026
Sebastian Jagniątkowski
Jun 10, 2026

Beyond the Chatbox: Copilot vs. AI Agents in Fabric & Power BI
Jakub Chyczewski
May 29, 2026